Towards democratizing insights from tabular data.
An interactive companion website to the paper "Open Tabular Insight Extraction: Where Do We Stand, and Where Should We Go?" by Daniel Gomm, Maarten de Rijke and Madelon Hulsebos. Read the preprint →
What if anyone could get the insights they need from data available to them?
What if data analysis would be as accessible as searching the web?
Preamble
Democratizing access to analytical knowledge would provide people with information based on data, providing grounds for informing oneself and making decisions based on the data, instead of guess-work. Research has long studied how to make analytical knowledge from tabular data accessible through natural language interactions, studied under labels such as Text-to-SQL, Table Question Answering, or Automated Data Science/Analysis. Over the past years, much progress has been made towards more capable and increasingly end-to-end systems. At the same time, LLM-based agents are increasingly employed to automate analysis as well. We propose "Open Tabular Insight Extraction" as a unified perspective to understand what research is, and should be, working towards to make the democratization of insights from tabular data a reality.
What is Open Tabular Insight Extraction?
Open Tabular Insight Extraction (OpenTI) is the task of satisfying a sufficiently directed insight need by deriving and presenting the analytical knowledge that most fully serves it, over a corpus of tabular data in an open setting where corpus contents are potentially diverse and not known when the need is expressed.
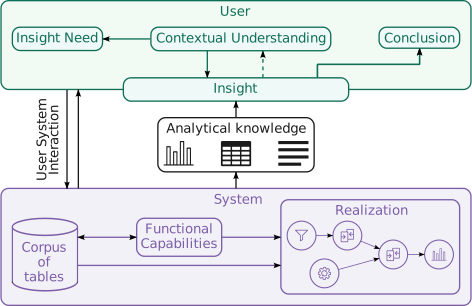
Put plainly, OpenTI expects that a user wants to gain some insight that they expect can be satisfied by analyzing data in a large collection of tabular data like a data lake that they have access to. User and system interact with another and the system aims to locate relevant data, analyze it, and extract the analytical knowledge that satisfies the user’s insight need.
Open
Insight needs are expressed over large corpora of tables whose contents, schema, and coverage may be unknown in advance. This requires systems to explore the available data and locate what is relevant.
Tabular
It concerns tabular data. The tabular structure enables analysis and it also shapes how data is discovered and how separate tables are combined.
Insight
The central objective is to provide insights, not just answer questions. An insight is the derived analytical knowledge read within a person's own context and understanding, shifting the focus on serving the need a person has instead of serving what they ask for out of context.
Extraction
The analytical knowledge is not necessarily directly stored in any single table. It is derived by composing analytical operations over the discovered data.
Why Open Tabular Insight Extraction?
Tabular data, found in databases, spreadsheets, data lakes, and on the web, is among the most pervasive forms of data we have . Organizations across the public and private sector depend on it to make decisions . Tables owe this to a compact and semantically rich structure that encodes entities, their attributes, and the relationships among them . Yet the knowledge that makes this data valuable does not just reside in the cells themselves. A table of measurements does not state how a quantity develops over time, where it concentrates, or how two variables relate. That knowledge surfaces only by locating relevant data, integrating it, and methodically applying computation . What people need in order to act is therefore not the table but the knowledge derived from it.
Surfacing that knowledge is demanding , and not only because of the analysis it takes. Organizations often hold vast collections of tables without a precise account of what they contain or where any particular information resides , so locating the right data is itself a substantial task before any analysis begins. The barrier between a person and the knowledge they seek is compound, a discovery problem layered on an analysis problem, both requiring skills, effort, and familiarity with the data that the people who need the knowledge may not have.
Consider a public-health officer who wants to understand how nitrogen dioxide pollution varies across a city’s boroughs, in order to inform a future traffic policy. The measurements exist, collected by the city’s sensor network, yet the officer does not know where in the municipality’s data lake they reside, how they are organized, or whether every borough is even covered. The sensors are tagged with coordinates rather than by borough, so data on administrative boundaries and on resident population has to be found and combined before any per-borough analysis can even start.
Unlocking this knowledge, so that anyone with a need can obtain insights without a background in data analysis or programming, would do for the knowledge held in tables what web search did for the information held in documents. Realizing that calls for treating the problem end to end, spanning the full path from the need a person has to presenting the knowledge in a form that delivers insight.
sensor_network.csv
| sensor_id | x | y | no2_ugm3 |
|---|---|---|---|
| SN-001 | 8 | 35 | 44.3 |
| SN-002 | 13 | 39 | 44.4 |
| SN-003 | 19 | 44 | 48.3 |
| SN-004 | 34 | 48 | 39.6 |
| SN-005 | 49 | 51 | 48.6 |
| SN-006 | 64 | 55 | 39.1 |
admin_boundaries.csv
| borough_id | name | boundary |
|---|---|---|
| B-01 | Westbridge | [(64.0, 47.0), (63.0, 30.0), …] |
| B-02 | Northgate | [(41.0, 45.0), (75.0, 48.0), …] |
| B-03 | Eastgate | [(64.0, 47.0), (75.0, 48.0), …] |
| B-04 | Harborview | [(64.0, 47.0), (71.0, 43.0), …] |
| B-05 | Southmoor | [(63.0, 30.0), (35.0, 22.0), …] |
From Answers to Insights
Systems that work over tables have grown steadily more capable, but they remain largely optimized for a narrow target, the information directly queried for, with success measured by how accurately an exact answer is returned. That only partly captures what surfacing knowledge from tables demands. Information extracted from a table is seldom wanted for its own sake. It is wanted for the insight it enables for the person who sought it.
What is asked for and the insight actually sought need not align. The officer might ask for a simple average of nitrogen dioxide per borough, yet that figure reflects where the sensors sit rather than where people are exposed, misleading the very policy decision it was meant to inform. An answer can be exactly correct as posed and still fail to serve the insight behind the question.
Centering on the insight rather than the queried answer widens the task. It gives a system reason to clarify the underlying need through interaction, to present knowledge so that insight can emerge rather than returning a bare result, and to make its derivation interpretable so that the result can be judged. These concerns stay peripheral when the target is a queried answer, and become central once the target is the insight.
roads.csv
| road_id | name | trace |
|---|---|---|
| R-01 | Main St | [(5.0, 10.0), (19.0, 28.0), …] |
| R-02 | Oak Ave | [(30.0, 76.0), (42.0, 60.0), …] |
| R-03 | Pine Ave | [(74.0, 85.0), (77.0, 62.0), …] |
| R-04 | Birch Ave | [(100.0, 39.0), (102.0, 49.0), …] |
| R-05 | Koi Ln | [(1.0, 29.0), (18.0, 44.0), …] |
| R-06 | Carp Ln | [(22.0, 4.0), (44.0, 18.0), …] |
| R-07 | Herring Ln | [(80.0, 10.0), (106.0, 22.0), …] |
| R-08 | Cod Ln | [(102.0, 49.0), (119.0, 48.0), …] |
- Eastgate 82.5 µg/m³
- Harborview 65.2 µg/m³
- Westbridge 62.9 µg/m³
- Northgate 49.3 µg/m³
- Southmoor 36.8 µg/m³